How has runners’ participation changed over the last 12 months according to the latest Sport England Actives Lives data?
The coronavirus pandemic had an unprecedented impact on the nation’s everyday activities including physical activity, event attendance, and consumer behaviour. As it progressed, Sport England’s Active Lives study collected ongoing data on people’s sports and physical activity behaviour. Data for activity levels among adults (aged 16+) in England between November 2020 and 2021 has recently been released.
Our Official Insights Partner, Sports Marketing Surveys, has explored the available data and pulled out the key running participation trends for Running Industry Alliance Members.
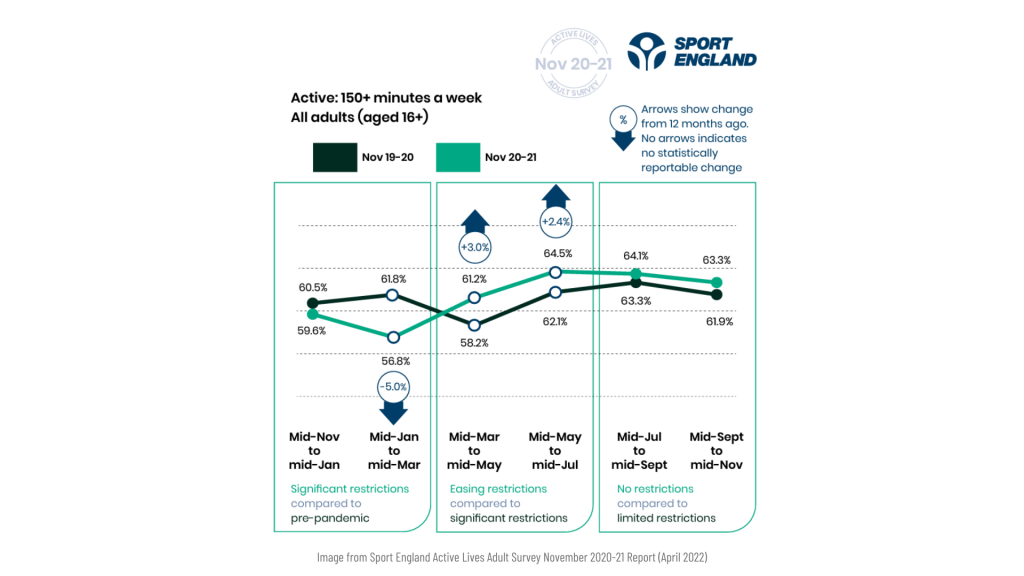
The national picture shows stabilisation
A spring and summer surge offset a troubled winter as national activity stabilised. Due to national lockdown restrictions in early 2021, the percentage of active adults (combined 150+ minutes of exercise or sport a week) declined by 5% during the period from mid-January to mid-March, compared to 12 months earlier. As restrictions eased during spring and ceased during summer 2021, activity levels increased from mid-March onwards and, throughout the rest of the reporting period, remained higher than those seen 12-months earlier. For the full year (Nov 20-21), 61.4% of adults were active for at least 150 minutes a week, which was the same figure seen between Nov 19-20 and 0.6m (-1.9%) fewer active adults than before the pandemic (Nov 18-19).
Three-quarters of adults were active at least twice in the last month
Between November 2020 and 2021, 34.6 million (75.6%) adults took part in sport and physical activity at least twice in the 28 days before being surveyed, a change of only 0.3% compared to 12-months earlier. But, what does the picture look like among running participants? Have runners continued to take part in organised and solo runs, or running events and competitions?
Running participation boomed in 2020
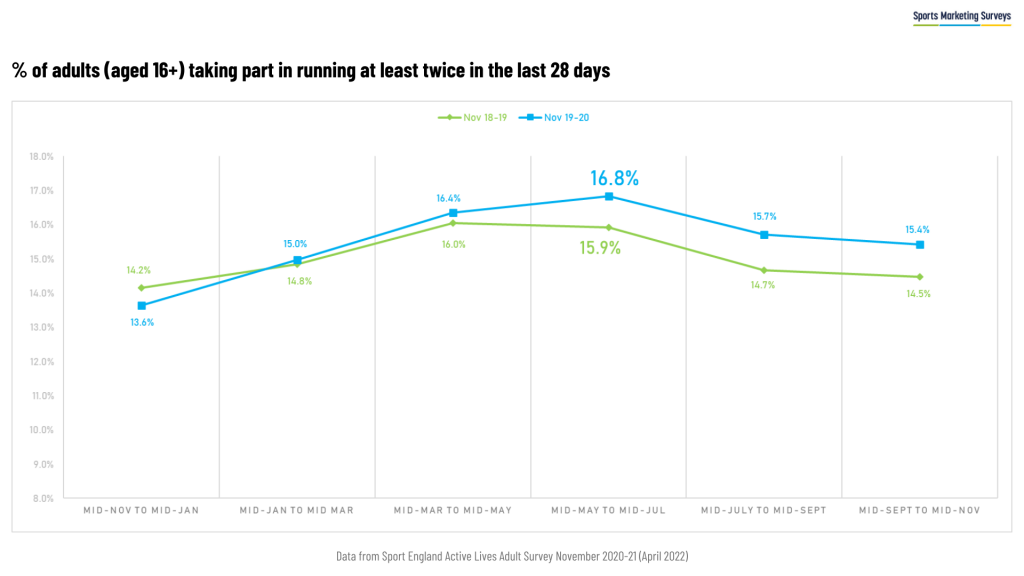
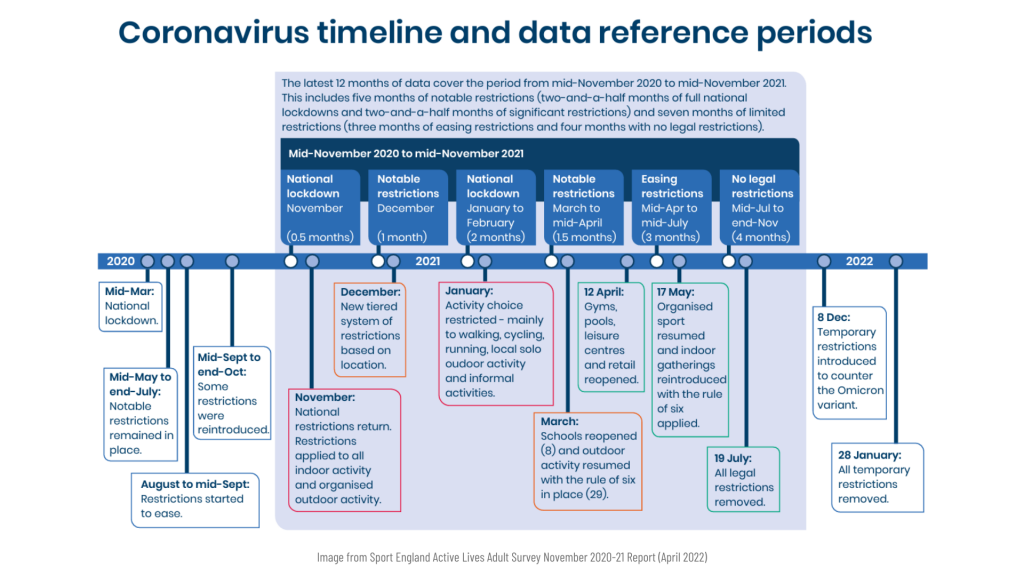
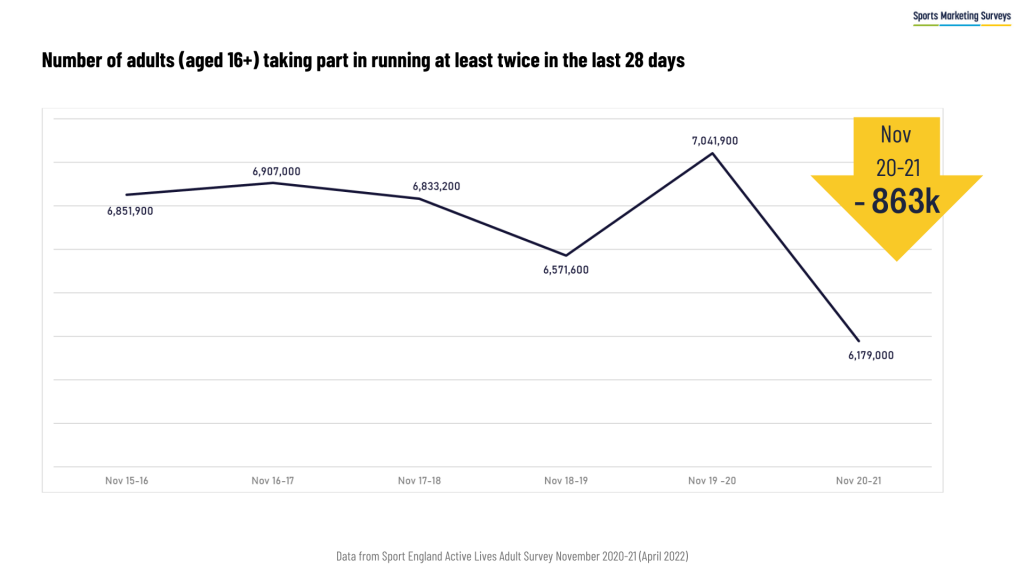
In the months between November 2019 and November 2020, more than 7 million adults took part in running at least twice in the previous 28 days. This annual rise in runners was predominantly driven by an increase in participation across mid-May to mid-July when 16.8% of the adult population took part in running at least twice in the previous 28 days. This was the period when exercise was one of the only acceptable reasons to leave home (see the Coronavirus timeline below). Running participation in 2020 remained above pre-pandemic figures for the rest of the reporting period, leading to an annual 1% increase in runners compared to 12 months earlier.
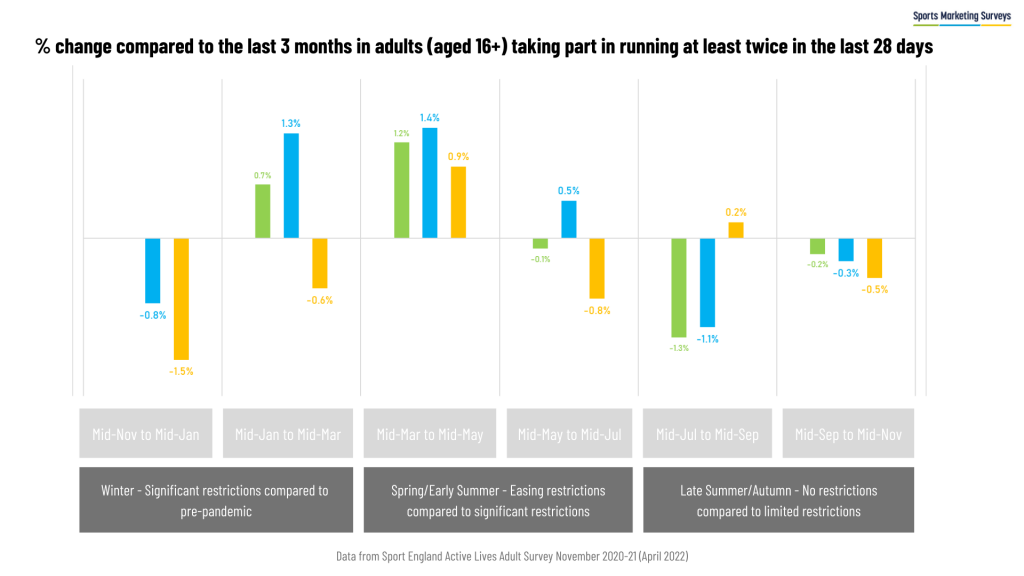
Running’s seasonal growth was interrupted in 202
Seasonal trends in running activity between November 2020 and 2021 did not always follow the trends seen pre-pandemic (2018-19) or the trends seen through the first 8 months of the pandemic (2019-20).
There were significant restrictions in place through the winter of 2020/2021, resulting in a drop in the percentage of adults running at least twice in the previous 28 days. Traditionally, this part of the year would see more runners than the pre-Christmas period, with a rise in those training as part of New Year’s resolutions or for the spring marathon season. As restrictions started easing in spring and early summer 2021, running activity levels increased and plateaued more in line with pre-pandemic trends, but activity levels did not replicate the increases seen from mid-May to mid-July seen 12-months before. During the later summer months of 2021 when restrictions were limited, running activity levels across mid-July to mid-September appeared to buck the trend of the declines seen in the previous two years. During the autumn months runners’ activity levels plateaued, falling back in line with the trends seen in the previous two years.
863K runners lost in the last 12 months Following the participation trends in runners’ activity between November 2020 – November 2021, almost 863K runners were lost across the 12 month period. This puts the percentage of adults taking part in running at least twice in the last 28 days below pre-pandemic levels and wipes out the gains seen 12 months earlier (13.5% of adults took part in running at least twice in the previous 28 days between Nov 20-21, 15.5% between Nov 19-20, and 14.5% between Nov 18-19).
Running is placed in the middle of the pack
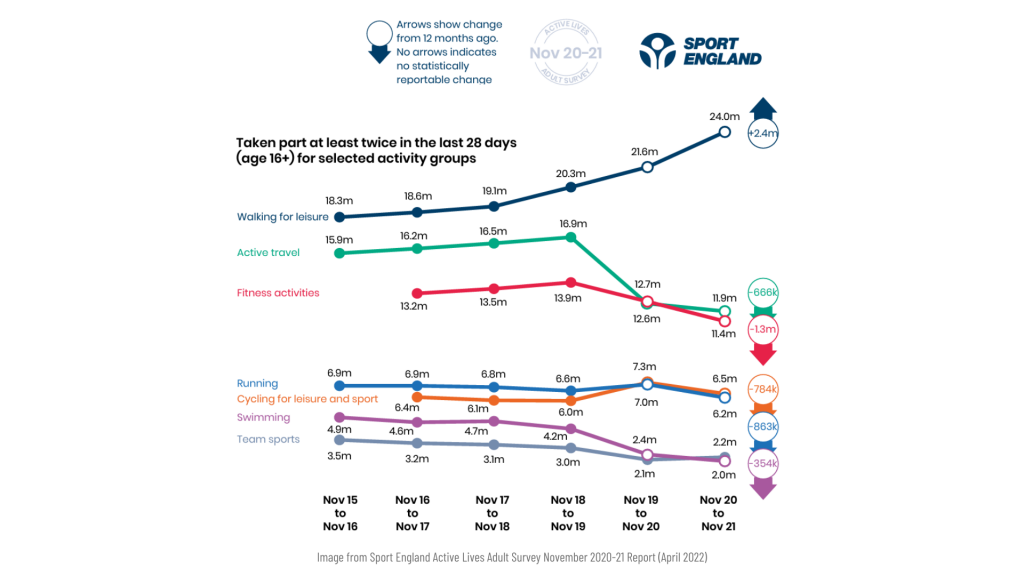
Taking an aerial view of running’s participation performance against the wider sports sector, running is placed in the middle of the pack and has some work to do to strengthen its position. Compared to walking for leisure, all sports shown, including running, are off the pace as walking for leisure participant figures are continuing to grow. Although not yet recovering to annual pre-pandemic levels, participation in team sports has largely returned to pre-pandemic figures of 3.2M since restrictions were lifted in Summer 2021.
After a rise in participation between Nov 19-20, both cycling and running participation has fallen back since restrictions were eased in spring 2021. Unlike running, cycling figures still remain above pre-pandemic levels but did drop by -784K in 20/21. Swimming, fitness activities, and active travel have all seen declines exacerbated by leisure and office facility closures during the pandemic and current levels are all below pre-pandemic levels.
How can the running sector work together to regain race pace?
Whilst this latest Active Lives data release places running in a weaker position than pre-pandemic, the running sector remains well placed to collaboratively drive growth and regain the 863K lost runners. As further Active Lives data is released, Sports Marketing Surveys will explore the highlighted trends among demographic groups such as gender, age, and socio-economic groups to look for indicators that could help explain why running participation has dropped below pre-pandemic levels rather than stabilising like the overall sporting trend. The shared knowledge of RIA members will also be crucial to helping the industry to work together to regain pace and advance forward together.
Notes and definitions
The headline indicator in this article is measured as the equivalent of 30 minutes activity at least twice in 28 days. Each session must last at least 10 minutes and be of at least moderate intensity.
An individual can reach the minimum threshold by a combination of two 30 minutes sessions across the last 28 days or by six 10 minute sessions, for example. This is measured for all activities including sports, fitness, dance, cycling and walking (including for travel).
All data in this report is estimates from the Active Lives survey. Data was taken from:
Active Lives Adult Nov 20-21 Tables 6-8 Types of activity
Sport England Active Lives Adult Survey November 2020-21 Report (April 2022)
The achieved sample was 198,911 (Nov 2015-16), 177,735 (Nov 2019-20) and 177,273 (Nov 2020-21). Population totals are created using ONS mid-2015, mid-2019, and mid-2020 population estimates and 2011
Overall sport and physical activity – All measured sporting activities combined.
Running – Running or jogging and treadmill
Cycling for leisure and sport – Cycling for leisure, Mountain biking, BMX, Road cycling or racing, Track cycling, Cyclo-cross, Cycling for Leisure and all other cycling, Exercise bike, Cycle class (e.g. spinning, RPM). Cycling for travel (including commuting) is excluded.
Walking for leisure – Walking for leisure (including dog walking, rambling, and Nordic walking). Walking around shops is excluded.
Team Sports – Football, Cricket, Rugby union, Rugby league, Touch rugby, Wheelchair rugby, Netball, Basketball, Wheelchair basketball, Field hockey, Volleyball, Rounders, Dodgeball, Baseball or softball, Lacrosse, Goalball, Handball, Gaelic sports, Other team sport.
Check out the SMS RIA profile here .